System Software

|
Home General Staff Contact Partners Alumni Research Areas Projects Papers Books Reports Awards Teaching Lectures Exams B.Theses M.Theses PhD Theses Go Abroad Misc Talks Library Gallery Links Search Webmaster |
Interactive Visualization of Exam DataThe goal of this project is to develop a web-based program in JavaScript (D3.js) that allows the visualization and the interactive exploration of data about exams. It should be used for the monitoring of things such as failure rates, number of registrations, and average marks per exam. The data is provided in anonymized form by JKU. For every course in every semester in which it happened the following data should computed and visualized in a compact form:
It should be possible to globally filter the courses
It should be possible to sort the courses according to different criteria (e.g., number of course registrations, number of graded students, average grade, failure rate). The visualization could look as follows: 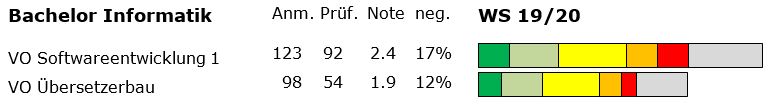
For every course there should be a details view with the following filtering options:
The project can either be done as a Bachelor's project or as part of the Master's course "Project in Software Engineering". Supervisor: Prof. Mössenböck |